
Personalized Steam Video Game Recommender

Table of Contents
- Introduction
- Data Preparation
- Exploratory Data Analysis
- Model Building
- Recommendation Dashboard
- Future Work
Introduction
Steam is a video game digitial distribution service and storefront developed by Valve Corportation in 2003. The platform, available on Windows, macOS, and Linux, also includes services including: automatic game updates, cloud storage for game progress, and community features such as direct messaging, in-game chats and a community market, making it the defacto default way to purchase and play PC games. Appropriately, the service is the largest digital distribution platform for PC gaming, estimated around 75% of the market share in 2013 according to IHS Screen Digest. It’s massive user base and reach across the PC gaming market makes it an excellent source of data on user behavior and video game engagement.
Our goal in this project is to build a robust recommender system on Steam data, to accurately predict video games that users are likely to buy and understand patterns in user behavior.
Dataset Source and Definitions:
Data for this project was acquired from UCSD Professor Julian McAuley’s graduate research lab. website The data was originally scraped from Australian Steam community data in 2017 by Julian McAuley and graduate assitants for their paper: Generating and personalizing bundle recommendations on Steam This dataset contains a comprehensive collection of data from the Australian Steam community, including detailed information on users’ owned games, video game metadata, and user reviews. The dataset contains information on 2,567,538 users and 15,474 games, making up over 10 million user-game interaction pairings (where each pairing represents a single game owned by a given user).
The original data is seperated into three datasets, respectively, containing information on users’ owned games, video game metadata, and user reviews. For our purposes, we will only use data on users’ owned games and games and game metadata. We will use the full set of columns from the users’ owned games dataset and take a subset of columns from the game metadata dataset, ignoring information such as discount prices, sentiment, and development status. Below are the definitions of the columns we will use from these datasets.
Games Metadata (steam_games):
| Column Name | Definition |
|---|---|
developer | developer name |
app_name | name of the game |
url | link to the game’s steam store page |
release_date | release date of the game |
price | retail price of the game, not including potential sales |
item_id | internal identifier for the game |
genres | list of developer assigned genres (e.g., action) |
tags | list of user assigned tags |
specs | list of game specificiations (e.g., ultrawide support) |
User Game Library Data (user_items):
| Column Name | Definition |
|---|---|
user_id | user’s display name |
steam_id | user’s internal unique indentifier (may be same as user_id) |
user_url | link to user’s steam profile page |
item_counts | total number of games owned by user |
item_id | internal identifier for the game |
item_name | name of the game (app_name) |
playtime_forever | user’s total playtime of the game |
playtime_2weeks | user’s playtime of the game within the past 2 weeks (at time of data collection) |
Data Preparation
In the following section, we cover the strategies and techniques we will employ to prepare the data for use with our recommender system.
Dataset Normalization
Both datasets are originally stored as JSON files, grouped by users and games respectively. For our purposes, we would like to extract all user-game interaction pairs. As a result, we flattened the the user_items data into a dataframe, with each row representing a single user-game pairing. Similarly, metadata on game genres, tags, and specs were stored in lists. For easier filtering in later steps (e.g., a user does not want to be recommended action games), these lists were normalized, adding a binary column (one hot encoding) for each possible genre, tag, and spec to each game. This approach adds considerable time to the data processing step but substantially reduces the time needed to filter recommendations.
Data Imputation
There were no real missing values to be found in the user_items table. However, there was quite a substantial amount of missing values within the games metadata table(>5%). To address this, we wrote a webscraper with the BeautifulSoup library to scrape what release dates and prices we could get from the steam store page of these games, as we noticed much of that information was up to date on the current store pages. As for the remainder games where release dates and/or prices were unable to be scraped, we noticed they were mostly unreleased games that never made it out of development or forgotten projects, so, we opted to drop them from our dataset.
Data Cleaning
For the most part, columns in both datasets were clean and usable as is. However, once again, we found issues with the release date column. Information within the column was stored in no consistent format, either containing complete gibberish or being represented in inconsistent data structures. Cases that were represented in foreign languages or contained gibberish such as “When it is finished” or “When it’s done!” made up less than 1% of the total dataset and were dropped. Cases where dates were represented in inconsistent formats (mixtures of numeric/alphabetized representations in different orderings) were parsed into the “%Y-%m-%d” format. For cases where dates were represented incompletely (only a year or year and month), the missing granularity (day of month / month and day of month) was randomly sampled from existing data satisfying the available granularity (year / year-month combo).
Exploratory Data Analysis
Take a look at the distrubution of games by playtime and/or ownership, to get a sense of “popularity” and what games may be over recommended in general by our algorithm.
Finish section later, including plot.ly graphs
Model Building
In the following section, we cover the validation strategies and candidate models we considered for our recommender system.
Validation Strategy
For simplicities sake, our recommender system will be evaludated on its accuracy in predicting whether or not a random user-game pair is or is not owned by the given user. Or, in other words, whether or not a witheld user-game pair is within the recommendations made for that user. We will be employing a 80-20 train-test split, with 3,370,914 user interactions in the train set and 842,729 in the test set. Since negative samples (user-game pairs where a user does not own the game) are needed for evaluating model accuracy, we will balance the test set by randomy sampling and including games that a user does not own, for each user in the original test set, doubling the size of our test set. On a futher note, since this project will be developed on a local jupyter notebook without the use of any scalable systems, we will evaluate candidate models on a subset of 20,000 rows from our true test set of over 1,000,000 rows.
Interaction Matrices
For our recommender system, we have chosen to implement matrix factorization techniques to take advantage of the massive amount of user interaction data that we have and the implicit patterns within that data. These matrix factorization techniques aim to decompose a given user-item interaction matrix into separate user and item matrices, representing users’ preferences and item features. Recommendations are then made by combining, with matrix multiplication, a given user’s preference vector, taken from the decomposed user matrix, with the item feature matrix to get a list of rankings for each item. Recommended items are then taken as a subset of the top ranked items.
For these interaction matrices, we considered two options: an interaction matrix encoding purely binary (owned/not-owned) data for user-game pairs, or an interaction matrix that would encode a sort of implicit rating for each user-game pair.
For the binary interaction matrix, interactions were encoded as 1 if the user owned the game, or 0 if the user did not own the game.
For the implicit rating interaction matrix, we calculated implicit ratings from 1-5 for each (user,game) pair where the user owns the game. User-game pairs where the user does not own the game are represented as 0. Rating scores were then calculated with respect to each game’s median playtime and the user’s playtime on that game:
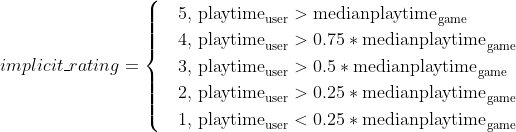
This approach for extracting an implicit rating from a user’s playtime on a game was chosen over the more simplistic approach of using available reviews data in order to address variances in average review ratings (some users may generally rate all games high/low) and to take advantage of information on users who simple do not review games.
Final interaction matrices were produced by pivoting the user_games dataframe and then converting them to sparse matrices to address memory constraints.
Considered Models
Within matrix factorization models, the two major candidates we considered were Bayesian Personalized Ranking (BPR) and Alternating Least Squares (ALS). Bayesian Personalized Ranking and Alternating Least Squares mainly differ in their loss functions and optimization techniques. Both are iterative algorithms that attempt to optimize their decomposed user and item matrices while minimizing loss between a reconstructed interaction matrix (decomposed user matrix multiplied with item matrix) and the original interaction matrix. BPR optimizes by maximizing the probability that, for random positive(owned) and negative(un-owned) sample, the positive sample is ranked higher than the negative sample. On the other hand, ALS optimizes by minimizing mean squared error between the reconstructed and original interaction matrix. The impact of this is that rating estimates made by ALS will be closer to true ratings, but may not maintain relative orderings of ratings as well as BPR. For the actual implementation of these models we chose to use Ben Frederickson’s implicit library.
We implemented each possible pairing of model and interaction matrix to get a general idea of how these models compare to each other, within our prediction task and evaluation strategy. These preliminary evaluations are as below:
| Model | Interaction Matrix | Accuracy |
|---|---|---|
| BPR | Binary | 0.79355 |
| ALS | Binary | 0.87225 |
| BPR | Implicit Rating | 0.79375 |
| ALS | Implicit Rating | 0.87520 |
Our evaluation results show that our ALS model performs significantly better than the BPR model, in terms of prediction accuracy. However, it does not show a drastic performance difference between using a binary interaction matrix versus our implicit ratings matrix. However, since the implicit ratings interaction matrix likely contains more nuanced player interaction data than the binary one, it may be more likely to produce more unique recommendations. As a result, we will move forwards with our implicit rating ALS model for parameter tuning and final deployment.
Model Tuning and Final Model
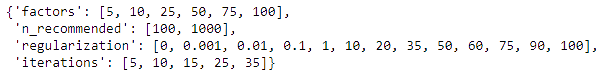
For model tuning, we chose to run sklearn’s gridsearch_cv on a set of tunable hyperparameters. Using the ALS model, we decided to tune the number of latent factors that represented user preferences and item features, the l2 regularization value, the number of optimization steps (iterations), and the number of top recommended games to evaluate the (user, game) pair on.
Each model was evaluated on the the 20,000 row subset of our test set. This process took 10 hours and 27 minutes to run on an 8 core processor, with a total cpu runtime of over 3 days. At the time of this projects completion, it was my first attempt working with such large datasets, and I had no real exposure to scalable systems. In hindsight, such processes would be much more effectively executed on cloud systems with multi-worker parralelization using technologies such as Apache Spark or Dask.
The best performing model in the grid search came out at 88.93% accuracy with the following parameters:
| Parameter | Value |
|---|---|
| factors | 100 |
| n_recommended | 1000 |
| regularization | 100 |
| iterations | 15 |
This model was then evaluated on the complete test set of 1,685,458 samples, giving us a testing accuracy of 89.31%
Recommendation Dashboard
So far, we have produced a model that is quite accurate at predicting whether or not a user owns a certain game. This prediction accuracy, may however, not perfectly reflect the reality of recommending users a given set of games. To evaluate the performance of our model through the eyes of actual users, we have written a function using our final model that recommends a number of games for a given user, filtered by arbitrary tags and release date constraints. Taking a quick look at the game recommendations for a few random users shows quite good diversity in the games recommended. Recommendations also do not seem to be dominated by the most popular games, for users who do not yet own them.
Top 20 Recommendations for User “76561198066143243”:
| Game | Score | Release Date | URL |
|---|---|---|---|
| Tribes: Ascend | 0.060076 | 2012-06-27 | link |
| APB Reloaded | 0.054478 | 2011-12-06 | link |
| Warframe | 0.047966 | 2013-03-25 | link |
| Defiance | 0.046084 | 2014-06-04 | link |
| War Thunder | 0.045788 | 2013-08-15 | link |
| Blacklight: Retribution | 0.045340 | 2012-07-02 | link |
| RIFT | 0.041517 | 2013-10-24 | link |
| Robocraft | 0.040458 | 2017-08-24 | link |
| Loadout | 0.038625 | 2014-01-31 | link |
| The Lord of the Rings Online™ | 0.035066 | 2012-06-06 | link |
| Warface | 0.032954 | 2014-07-01 | link |
| Emily is Away | 0.030224 | 2015-11-20 | link |
| Arma 3 | 0.028864 | 2013-09-12 | link |
| Counter-Strike: Global Offensive | 0.027613 | 2012-08-21 | link |
| DayZ | 0.027536 | 2013-12-16 | link |
| Block N Load | 0.026661 | 2015-04-30 | link |
| Evolve Stage 2 | 0.025975 | 2015-02-10 | link |
| Star Conflict | 0.025483 | 2013-02-27 | link |
| Mount & Blade: Warband | 0.024494 | 2010-03-31 | link |
| Natural Selection 2 | 0.024175 | 2012-10-30 | link |
Future Work
On the next step of this project, an interactive dashboard can be deployed to allow users outside of our training data, which only included Australian users in 2017, to generate and view their own game recommendations. This could be implemented by using Steam’s open API to gather information on a new user’s game library, while deploying server side python code to process that information and run it with our final recommender model, saved with pickling to avoid re-training.